


- Portada
- Volume 30 (2026)
- Numéro 3
- A new tool for monitoring and improving Bacillus sporulation for industrial applications


Vista(s): 0 (0 ULiège)
Descargar(s): 0 (0 ULiège)

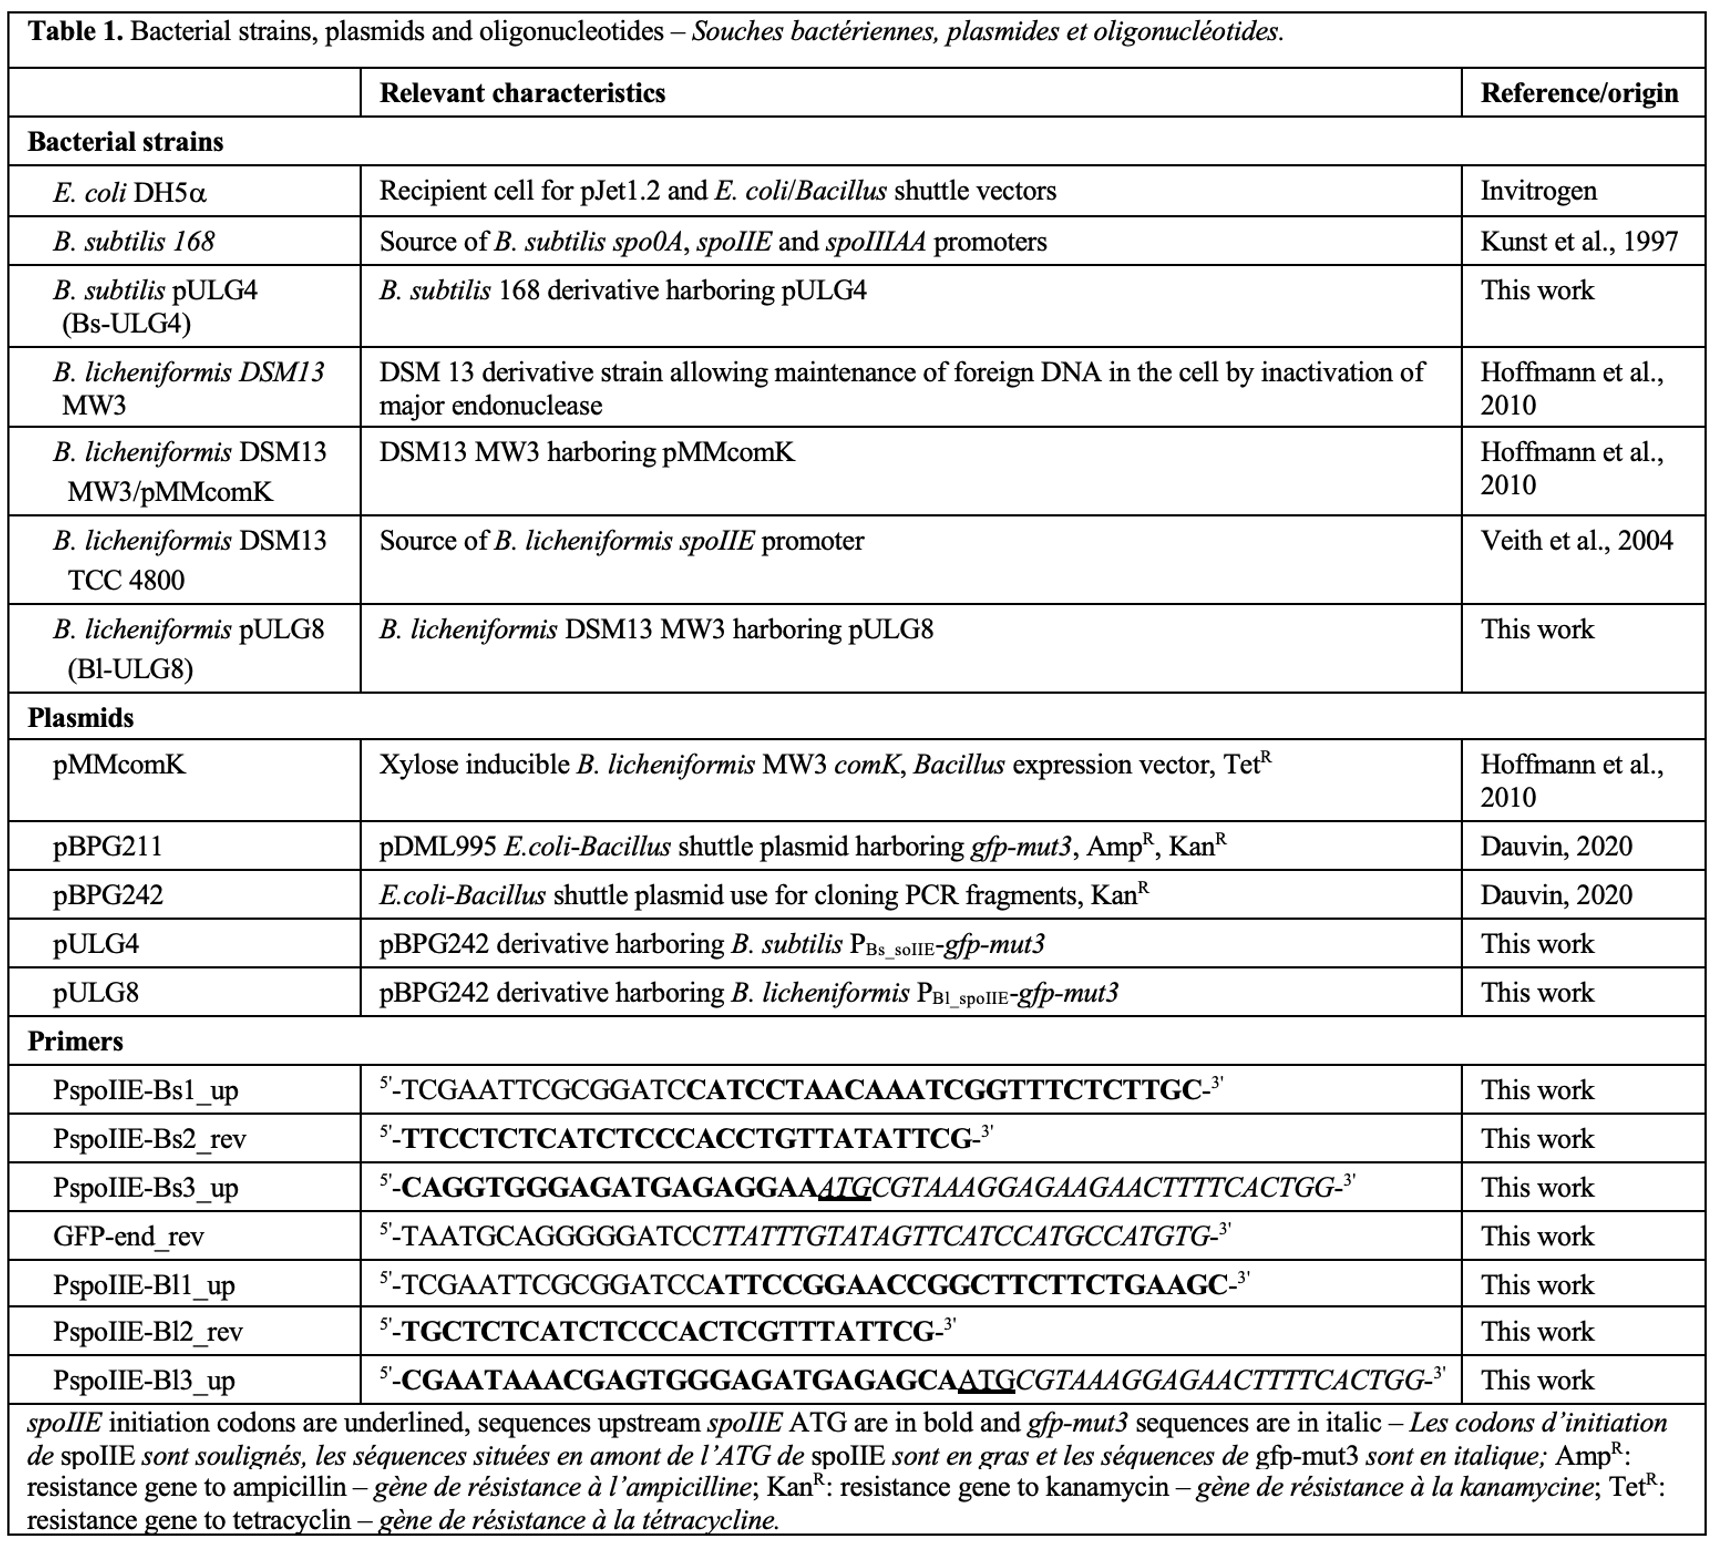
A new tool for monitoring and improving Bacillus sporulation for industrial applications

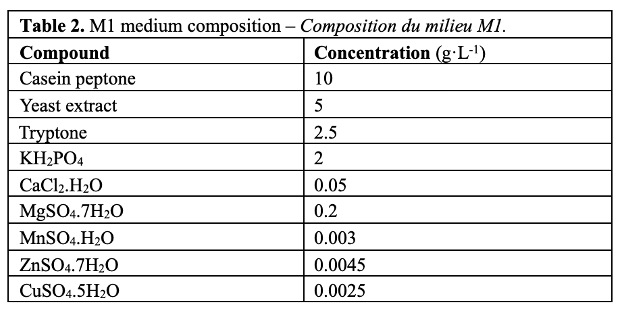
Documento adjunto(s)
Version PDF originaleRésumé
Un nouvel outil pour le suivi et l’amélioration de la sporulation de Bacillus pour des applications industrielles
Description du sujet. L'utilisation des endospores de Bacillus subtilis et de Bacillus licheniformis comme probiotiques, biostimulants ou biofertilisants est bénéfique pour les humains, les animaux ou les plantes. La résistance des endospores aux conditions extrêmes réduit les coûts des processus industriels et de commercialisation en minimisant les exigences de la chaîne du froid. Cependant, maximiser la conversion des cellules végétatives en endospores représente un défi industriel, économique et biologique important.
Objectifs. Développer un gène rapporteur pour suivre la sporulation chez Bacillus et optimiser la production des endospores.
Méthode. Les constructions génétiques et les cultures bactériennes ont suivi les protocoles standards ou spécifiques à Bacillus. L'expression du gène rapporteur (gfp-mut3) régulé par un promoteur de sporulation a été suivie par fluorescence. La cytométrie en flux a été utilisée pour analyser la population de cellules bactériennes et mettre en évidence une hétérogénéité potentielle lors de la sporulation.
Résultats. Trois promoteurs spécifiques de la sporulation chez Bacillus (spo0A, spoIIE, spoIIIAA) ont été sélectionnés après une analyse bibliographique et bioinformatique. Seul le promoteur spoIIE, fusionné au gène gfp-mut3 et porté par un plasmide navette, a permis de suivre l'initiation de la sporulation en mesurant la fluorescence de la GFP. Cette construction a également permis de visualiser l'expression transitoire de spoIIE et l’hétérogénéité de la population bactérienne lors de la sporulation de B. subtilis et B. licheniformis en flacons et en fermenteurs.
Conclusions. L’outil développé dans cette étude permet d’identifier efficacement les conditions de culture les plus favorables à une production élevée d’endospores de Bacillus, contribuant ainsi à l’optimisation des procédés de production et à une meilleure constance des rendements en endospores.
Abstract
Description of the subject. The use of Bacillus subtilis and Bacillus licheniformis as probiotics, biostimulants, or biofertilizers provides numerous benefits for humans, animals, and plants. Their ability to form endospores grants them high resistance to extreme conditions. From an industrial perspective, endospore stability during manufacturing, storage, and transportation reduces costs by minimizing cold chain requirements. However, maximizing the conversion of vegetative cells into endospores presents significant industrial, economic, and biological challenges.
Objectives. To construct a molecular reporter tool for monitoring Bacillus sporulation and optimizing the conversion of vegetative cells into endospores.
Method. DNA manipulations and bacterial growth followed standard or Bacillus-specific protocols. The expression of the gfp-mut3 reporter gene, driven by the selected sporulation-specific promoter, was monitored via GFP fluorescence. Flow cytometry was used to analyze the bacterial cell population and highlight possible heterogeneity during sporulation initiation.
Results. Sporulation-specific reporter promoters were identified using a combination of bibliographic and bioinformatics analyses. Among the three selected B. subtilis promoters regulating spo0A, spoIIE, and spoIIIAA, only the spoIIE promoter, when fused to gfp-mut3 and carried on a shuttle plasmid, enabled reliable monitoring of sporulation initiation through GFP fluorescence. This construct also allowed visualization of the transient expression of spoIIE during B. subtilis and B. licheniformis sporulation in flasks and fermenters.
Conclusions. The tool developed in this study effectively identifies optimal growth conditions for high-yield Bacillus endospore production, facilitating process optimization and improving consistency in endospore production.
Tabla de contenidos
Received 7 March 2025, accepted 25 August 2026, available online 16 September 2026.
This article is distributed under the terms and conditions of the CC-BY License (http://creativecommons.org/licenses/by/4.0)
1. INTRODUCTION
1Probiotics are defined as living microorganisms that, when administered orally in adequate amounts, confer health benefits to humans and animals (Sarita et al., 2025). Biostimulants, on the other hand, are living microorganisms designed to enhance plant physiology through non-nutritional mechanisms, for example by promoting root development or improving plant tolerance to stress. Biostimulants can be applied to soil, seeds, or leaves, depending on the desired effect. In contrast, biofertilizers, also consisting of live microorganisms, enhance the plant’s ability to utilize existing resources. They are typically applied to seeds and soil to increase the availability of essential nutrients like nitrogen and phosphorus, promoting healthier plant growth (Shahzad et al., 2025).
2The effectiveness of probiotics, biostimulants or biofertilizers requires that they must be alive up to their site of action. For example, probiotics, that are absorbed alive, must survive in the digestive system. This capacity for survival depends on the intrinsic resistance of the strain, but also on the quantity ingested. Sometimes, probiotics are lysed as they pass through the stomach while others persist even in the stools (Cutting, 2011; Mckenney et al., 2013). In general, the survival rate of probiotics depends on their resistance to the low pH of gastric juice in the stomach, the detergent power of the bile salts secreted in the duodenum and the hydrolytic activity of enteric digestive enzymes. In this regard, utilizing spore-forming bacteria as probiotics offers distinct advantages owing to the resilience of spores against extreme chemical and physical conditions such as acidic pH, heat, UV radiation, and bile secretion. Moreover, their robust spore-forming capability makes spore forming bacteria ideal for agricultural formulations, ensuring stability and effectiveness under diverse environmental conditions. Although these applications are often described under different terms, such as probiotics, biostimulants, or biofertilizers, many Bacillus species are used across these sectors. In all cases, their industrial production relies on the same key feature: the formation of highly resistant spores. Therefore, understanding and controlling sporulation is a central challenge common to these different applications. Among these bacteria, those within the Bacillus genus stand out for their ability to form endospores. Bacillus species frequently employed as probiotics include Bacillus subtilis, and Bacillus licheniformis. The utilization of the latter as probiotic, biostimulant or biofertilizer has experienced a notable surge in recent years (Elshaghabee et al., 2017; Todorov et al., 2022; Etesami et al., 2023; Stulke et al., 2023). Bacillus licheniformis, like other Bacillus species, is a Gram-positive, rod-shaped, endospore forming bacterium belonging to phylum Bacillota (synonym: Firmicutes) and is a member of family Bacillaceae. It is generally regarded as non-pathogenic species due to the absence of invasive traits and plays an important role in biotechnology for expression platform of recombinant proteins, compound producer and environmental applicant. As probiotic, its application includes products for human health, veterinary use and aquaculture (Chau et al., 2021). It can be used alone or combined with other probiotic strains (Kan et al., 2021; Muras et al., 2021; Biswas et al., 2023).
3The most extensively studied endospore-forming bacterium is B. subtilis, often regarded as the paradigm for understanding the intricate process of endospore formation within the Bacillus genus (Errington, 2003; Mckenney et al., 2013; Riley et al., 2020; He et al., 2025). Under nutrient-rich conditions, B. subtilis undergoes cycles of elongation and medial division, constituting its vegetative state. However, when dividing cells sense nutrient deprivation, they shift to a sporulation state, representing an adaptive response to starvation. The process of endospore formation in B. subtilis is delineated into eight stages (labelled 0 to VII), each marked by distinct morphological changes, except for stage 0, which marks the initiation of an asymmetric cell division (Figure 1).
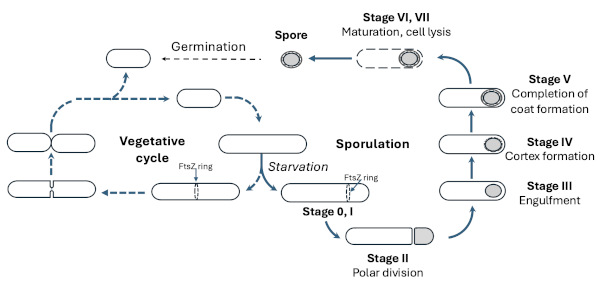
Figure 1. Sporulation cycle of B. subtilis – Cycle de sporulation de B. subtilis.
This drawing illustrates the connection between the vegetative (left) and sporulation (right) cycles of B. subtilis. Under unfavourable conditions, such as starvation, B. subtilis evolves from a vegetative state to sporulation. The progression from a vegetative state to endospore release into the environment is divided into eight steps, numbered from 0 to VII. The FtsZ-ring (represented by a dashed ellipse) initiates binary fission through an asymmetric division, ultimately leading to the formation of the endospore. For more details, see the text – Cette illustration montre le lien entre les cycles végétatif (à gauche) et de sporulation (à droite) de Bacillus subtilis. Dans des conditions défavorables, telles que la privation de nutriments, B. subtilis passe d’un état végétatif à la sporulation. La progression de l’état végétatif jusqu’à la libération de l’endospore dans l’environnement est divisée en huit étapes, numérotées de 0 à VII. L’anneau de FtsZ (représenté par une ellipse en pointillés) initie la fission binaire par une division asymétrique, conduisant finalement à la formation de l’endospore. Pour plus de détails, voir le texte.
4Endospore-forming Bacillus species offer several advantages from an industrial perspective. Their remarkable stability to chemical and physical stresses allows long-term storage without the need for special conditions, such as refrigeration or freezing. This reduces storage costs and simplifies logistics for industrial facilities. Additionally, Bacillus species are generally well-suited for large-scale fermentation processes. Their rapid growth rates and ability to utilize a broad range of inexpensive carbon and nitrogen sources, make them particularly cost-effective production organisms. Nevertheless, the main challenge in industrial Bacillus endospore production is achieving both a high density of vegetative cells during fermentation and efficient conversion of these cells into endospores. Sporulation efficiency (% spore) is defined as the ratio between the number of viable endospores per unit volume (Nb spores/volume) and the total number of colony-forming units (CFU) per unit volume. The CFU/volume includes both viable endospores and vegetative cells that have not yet undergone sporulation. The %Spore is influenced by sporulation heterogeneity within the bacterial cell population. Indeed, vegetative cells do not initiate or complete sporulation synchronously or with the same efficiency. Instead, individual cells display variability in sporulation timing and outcome, even under identical environmental conditions. This heterogeneity may result from differences in physiological state, gene expression patterns, and intracellular signaling pathways (Maamar & Dubnau, 2005; Dubnau & Losick, 2006). For example, distinct subpopulations may respond differently to environmental signals that trigger sporulation, resulting in asynchronous sporulation dynamics. Consequently, the extent to which sporulation heterogeneity affects industrial performance depends on the specific requirements and operational constraints of the intended application. Strategies to mitigate sporulation heterogeneity, such as optimizing culture conditions or process monitoring and control, can help address these challenges and improve the reliability and efficiency of industrial processes involving Bacillus sporulation (Stanton et al., 2001; Biermann & Beutel, 2023).
5In this study, we present the development of a novel tool for monitoring the sporulation state of B. subtilis and B. licheniformis at the single-cell level. This tool involves the construction of an Escherichia coli/Bacillus shuttle plasmid containing a gene encoding green fluorescent protein (GFP) under the control of a sporulation-specific promoter selected in this study. We utilized this tool to track the sporulation process of both B. subtilis and B. licheniformis in culture flasks and fermenters. Experiments were conducted using three distinct culture media, both with and without supplementation of various sugars, to investigate their impact on sporulation dynamics.
2. MATERIALS AND METHODS
2.1 Bacterial strains, plasmids and growth media
6All strains and plasmids used in this study are listed in table 1. Escherichia coli DH5 was used for plasmid construction and was grown in Luria-Bertani medium (LB) supplemented with the appropriate antibiotic to select recombinant clones. Bacillus subtilis pULG2 (Bs-ULG2) is a derivative of B. subtilis 168 harboring pULG2, a plasmid carrying gfp-mut3 under the control of B. subtilis spoIIE promoter (PBs_spoIIE-gfp-mut3). Bacillus subtilis 168 was transformed in a one-step procedure using the two-step nutrient shift down method (Msadek et al., 1998). Bacillus licheniformis pULG4 is a derivative of B. licheniformis DSM13 MW3 harboring pULG4, a plasmid carrying gfp-mut3 under the control of B. licheniformis spoIIE promoter (PBl_spoIIE-gfp-mut3). Bacillus licheniformis MW3/pMMcomK is a highly competent cell line derived from B. licheniformis DSM13 in which the two type I restriction modification systems have been deleted. This strain contains plasmid pMMcomK in which comK is involved in the natural competence of Bacilli, under the control of the XylR repressor inactivated by xylose. Bacillus licheniformis MW3/pMMcomK was transformed by inducible genetic competence as described by Hoffmann et al. (2010).
7Prior to experiments evaluating PspoIIE-gfp-mut3 expression, B. subtilis and B. licheniformis strains were propagated in LB medium. Expression experiments were subsequently conducted in M1 and M4 media. The composition of M1 is listed in table 2. M4 is an industrial medium of proprietary composition and was included to evaluate the performance of the construct under conditions representative of an industrial environment. M1 and M4 were supplemented with kanamycin (10 µg·mL–1) to keep the plasmids harbouring PspoIIE-gfp-mut3 in the recombinant Bacillus strains. M1G and M1X media correspond to M1 supplemented with glucose (0.5%, w/v) and xylose (0.5%, w/v), respectively.
8Cells were grown overnight on LB agar plates supplemented with kanamycin (10 µg·mL–1) and a single colony was then inoculated into 3 mL LB-kanamycin medium (starter culture). After overnight incubation at 37 °C with shaking (300 rpm), a 50 mL volume of M1, either supplemented or not with glucose or xylose, or M4, was inoculated with the starter culture to achieve a final cell density equivalent to A600 = 0.1. Cells were then cultivated at 37 °C with shaking (300 rpm) and samples were collected throughout the growth process to measure GFP-mut3 fluorescence and to count both total flora and spores.
2.2. Plasmid construction
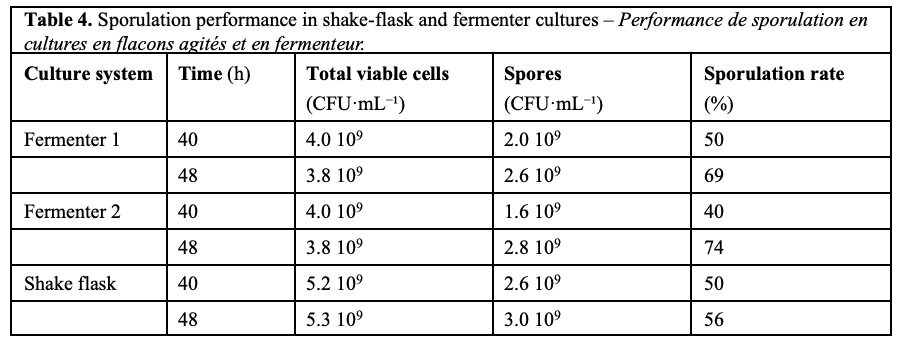
9The promoter region of B. subtilis 168 spoIIE, 201 bp upstream of its initiation codon, was fused to gfp-mut3 using overlap extension PCR (OE-PCR) as follows (Xiao et al., 2007). PBs_spoIIE was amplified from B. subtilis 168 genomic DNA using the PspoIIE-Bs1_up and PspoIIE-Bs2_rev primers (Table 1). The resulting 215 bp fragment presented an additional 14 nucleotides at its 5'-OH end, included in PspoIIE-Bs1_up. gfp-mut3 (Cormack et al., 1996) was amplified from the pBPG211 plasmid (Dauvin, 2020) using the PspoIIE-Bs3_up and GFP-end_rev primers. The fragment obtained (950 bp) included gfp-mut3 with 20 bp of the PBs_spoIIE promoter region upstream of the spoIIE initiation codon at the 5'-OH end, and a BamHI restriction site at the 3'-OH end. The two overlapping fragments were assembled by PCR using the PspoIIE-Bs1_up and GFP-end_rev primers and the previously amplified purified fragments (Table 1).
10The resulting 1,000 bp fragment was cloned into the E. coli-Bacillus shuttle vector pBPG242 using In-Fusion cloning (Takara, Bio USA Inc.) to generate the recombinant plasmid pULG4. This plasmid was then introduced into E. coli DH5α. Five clones were selected and cultivated in LB medium supplemented with 25 µg·mL-1 of kanamycin. The recombinant plasmids were purified and sequenced using the dye-terminator method on the GIGA platform at the University of Liège, Belgium. Sequencing confirmed that all inserts were error-free. The pULG4 plasmid was subsequently used to transform B. subtilis 168, resulting in a B. subtilis strain pULG4 (Bs-ULG4) harboring a plasmid carrying PBs_spoIIE-gfp-mut3 and exhibiting resistance to kanamycin (25 µg·mL-1). This strain was subsequently used to study the expression of spoIIE during B. subtilis sporulation.
11The same strategy was followed to construct the B. licheniformis pULG8 (Bl-ULG8), a strain harboring pULG8, a plasmid carrying gfp-mut3 under the control of the B. licheniformis DSM13 spoIIE promoter, included within the 215 bp upstream of the initiation codon of B. licheniformis DSM13 spoIIE. This construct was obtained using the PspoIIE-Bl1_up, PspoIIE-Bl2_up, PspoIIE-Bl3_up and GFP-end_rev primers. Bacillus licheniformis DSM13 ATCC 4800 was used as DNA source for the B. licheniformis spoIIE promoter. Bacillus licheniformis MW3/pMMcomK, a highly competent cell line derived from B. licheniformis DSM13 ATCC4800 in which the two type I restriction modification systems have been deleted, and harboring the pMMcomK plasmid carrying comK (involved in the natural competence of Bacilli and under the control of the xylose repressor XylR), was used as the recipient cell for pULG8. After transformation with pULG8, the pMMcomK plasmid was eliminated by cultivating the B. licheniformis strain without tetracycline (the antibiotic selection marker for pMMcomK).
2.3. Total flora and spore count
12The total count of viable bacteria and spores (total flora), expressed as the number of colony-forming units per mL (CFU·mL-1), was determined using serial 1/10 dilutions in LB medium and spread plating techniques (LB agar with overnight incubation at 37 °C). Viable spores were counted using the same method, with the exception that at the 1/10 dilution, vegetative cells were killed by incubating the diluted cell culture at 80 °C in a water bath for 10 min. After incubation, the diluted cell culture was cooled in cold water before continuing the serial dilution. The sporulation yield (expressed as a percentage) was calculated as the ratio of the number of spores·mL-1 to the total flora·mL-1, multiplied by 100.
13To quickly estimate the number of cells in the culture medium, cell density was measured by determining A600. Prior to measurement, samples were diluted to achieve an A600 value between 0.1 and 0.5.
2.4. Bulk cell fluorescence analysis
14A 1 mL sample of the culture was centrifuged at 15,000 g for 5 min at 4 °C. The resulting cell pellet was resuspended in 200 µL of 0.9% (w/v) NaCl. The cell suspension was then transferred to a 96-well microplate (Flat Black, colorless background, Greiner). Bulk cell fluorescence was measured using a SpectraMax M2e fluorimeter (Molecular Devices). The GFP acquisition parameters were set with excitation and emission wavelengths at 485 nm () and 528 nm (), respectively. For all experiments, the different settings of the fluorimeter were unchanged. The mean fluorescence per cell was determined by dividing the fluorescence value by the OD600.
2.5. Flow cytometry analysis
15Flow cytometry analyses of PspoIIE single-cell activity were performed using a Cytoflex flow cytometer (Beckman Coulter) equipped with a 488 nm blue laser and a 524 nm GFP recovery filter. A 1 mL aliquot of culture was transferred into a 1.5 mL microcentrifuge tube and centrifuged at 15,000 g for 5 min at 4 °C. The resulting cell pellet was then resuspended in 200 µL of a 10% (v/v) glycerol solution and stored at -20 °C prior to flow cytometric analysis to preserve the GFP fluorescence. Data acquisition was restricted to events defined by forward-angle light scatter (FSC) and side scatter (SSC), with an event rate maintained below 500 events per second. Before data collection, samples were allowed to run for approximately 1 min to ensure signal stabilization, after which a minimum of 500 events was acquired. Flow cytometry data were collected and processed using FlowJo V10 software.
2.6. Glucose determination (Bipp et al., 1997)
16Glucose concentration was determined using ion exclusion chromatography on an ICSep ICE-iON 300 column (78 x 300 mm, ChromTech) with the aid of an HPLC system (Perkin Elmer Flexar) equipped with a refractive index detector (Perkin Elmer Altus A-10). The analytical conditions were as follows: a flow rate of 0.4 mL·min-1, an eluent of H2SO4 (0.01 N), and a column oven temperature set at 50 °C. Sample preparation was conducted as follows: 1 mL of the culture medium was centrifuged (15,000 g, 5 min, 4 °C) to remove bacterial cells. The supernatant (900 µL) was then supplemented with 100 µL of trichloroacetic acid to precipitate proteins. After a second centrifugation (15,000 g, 30 min, 4 °C), the supernatant was ready for analysis. The glucose concentration was calculated from a previously obtained standard curve
2.7. Pilot-scale fermentation experiments
17The fermentation experiments were carried out in a Biostat® B fermenter (Sartorius) with a total volume of 20 L and a working volume of 10 L. The inoculum was prepared from a preculture grown in a 500 mL Erlenmeyer flask containing LB medium supplemented with kanamycin (10 µg·mL-1) and incubated for 16-18 h at 37 °C with shaking (180 rpm).
18Cultures were performed at 37 °C in the selected medium supplemented with kanamycin (10 µg·mL-1). The pH was maintained at 7.0 ± 0.1 using automatic regulation with 12.5% KOH or 1 M H₃PO₄. Aeration was set at 1 vvm, and the dissolved oxygen level was controlled using a cascade system combining increased airflow, oxygen enrichment, and agitation adjustments (300-400 rpm). Attention was paid to foam prevention, especially for B. licheniformis pULG8 cultures, by controlled addition of a compatible antifoam agent.
19Samples were collected every 2-3 h to monitor cell growth (A600) and endospore counts. Samples intended for A600 measurements were diluted in distilled water to obtain A600 values below 1. For fluorescence measurements, samples were centrifuged (5 min, 15,000 g), and the pellets were resuspended in 200 µL of 10% glycerol. The suspensions were stored at -20 °C to preserve GFP-mut3 fluorescence until analysis or directly analyzed by flow cytometry at the end of the culture.
2.8. Curve fitting
20Curve fitting analyses were performed using Prism software (GraphPad, version 10.2.3). A Gompertz fitting (Zwietering et al., 1990) was conducted to model the bacterial growth data, providing the maximum specific growth rate (µm). For the variation of GFP fluorescence over time, data points were fitted using a Gaussian model. For both fittings, the mean and standard deviation values were computed.
3. RESULTS
3.1. Selection and construction of reporter genes
21To visualize the transition of B. subtilis from the vegetative state to sporulation, promoter-gfp fusions were constructed using genes known to be expressed or upregulated during different stages of endospore formation. Based on previous studies, the promoters of spo0A, spoIIE, and spoIIIAA were selected as potential reporters, corresponding to early, intermediate, and late stages of sporulation, respectively (Carniol et al., 2005; Guillot & Moran, 2007; Mirouze et al., 2011). The GFPmut3 variant was chosen for its high stability and long intracellular half-life, allowing signal accumulation and improved detection sensitivity. This stability also helps preserve fluorescence during sample preparation and handling prior to analysis (Cormack et al., 1996).
22Approximately 200 bp upstream of the initiation codon, encompassing the promoter region recognized by RNA polymerase, were amplified and fused to the gene encoding the green fluorescent protein-mut3 (gfp-mut3) via OE-PCR (see Materials and methods). After cloning and sequence verification, the resulting fragments were inserted into the shuttle plasmid pBG211. The corresponding plasmids were introduced into B. subtilis 168 to generate the recombinant strains.
23Fluorescence monitoring during the growth of these strains revealed that only the construct carrying the spoIIE promoter produced a detectable and reproducible fluorescence signal, appearing as cells entered the stationary phase. In contrast, no fluorescence was detected for the spo0A and spoIIIAA promoter fusions under the same test conditions.
24Because the spoIIE construct provided a clear and transient fluorescence signal consistent with the expected timing of sporulation initiation, subsequent experiments were focused on this reporter system. The corresponding B. subtilis strain was designated Bs-ULG4 (see Materials and methods).
25For the study in B. licheniformis, an equivalent construction based on the spoIIE promoter was generated (see Materials and methods), resulting in strain Bl-ULG8. This strain produced fluorescence profiles similar to those observed in Bs-ULG4. The nucleotide sequences of the constructed fusions are presented in figure 2.
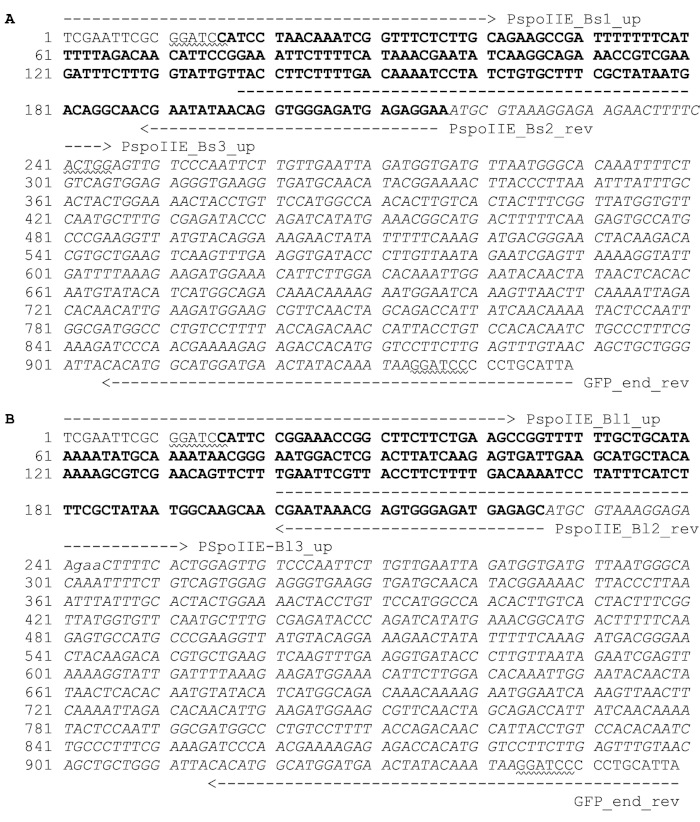
Figure 2. Nucleotide sequences of OE-PCR-amplified fragments containing B. subtilis (A) or B. licheniformis (B) spoIIE promoters fused to gfp-mut3 – Séquences nucléotidiques des fragments amplifiés par OE-PCR contenant les promoteurs spoIIE de B. subtilis (A) ou de B. licheniformis (B) fusionnés à gfp-mut3.
Promoter sequences are shown in bold. gfp-mut3 sequences are italicized. BamHI restriction sites are wavy underlined. Nucleotide sequences of amplimers are indicated by dashed arrows, and their floating ends are in normal case. The amplified spoIIE promoter regions from B. subtilis 168 and B. licheniformis DSM13 show 62% nucleotide identity over the ~200 bp fragment used in this study. For more details, see text and Materials and methods – Les séquences promotrices sont indiquées en gras. Les séquences gfp-mut3 sont en italique. Les sites de restriction BamHI sont soulignés en pointillés. Les séquences nucléotidiques des amplimères sont indiquées par des flèches en pointillés et leurs extrémités libres sont en caractères normaux. Les régions promotrices spoIIE amplifiées issues de B. subtilis 168 et de B. licheniformis DSM13 présentent une identité nucléotidique de 62 % sur le fragment d'environ 200 pb utilisé dans cette étude. Pour plus de détails, voir le texte et la section Matériel et méthodes.
3.2. Sporulation dynamics in shake-flask
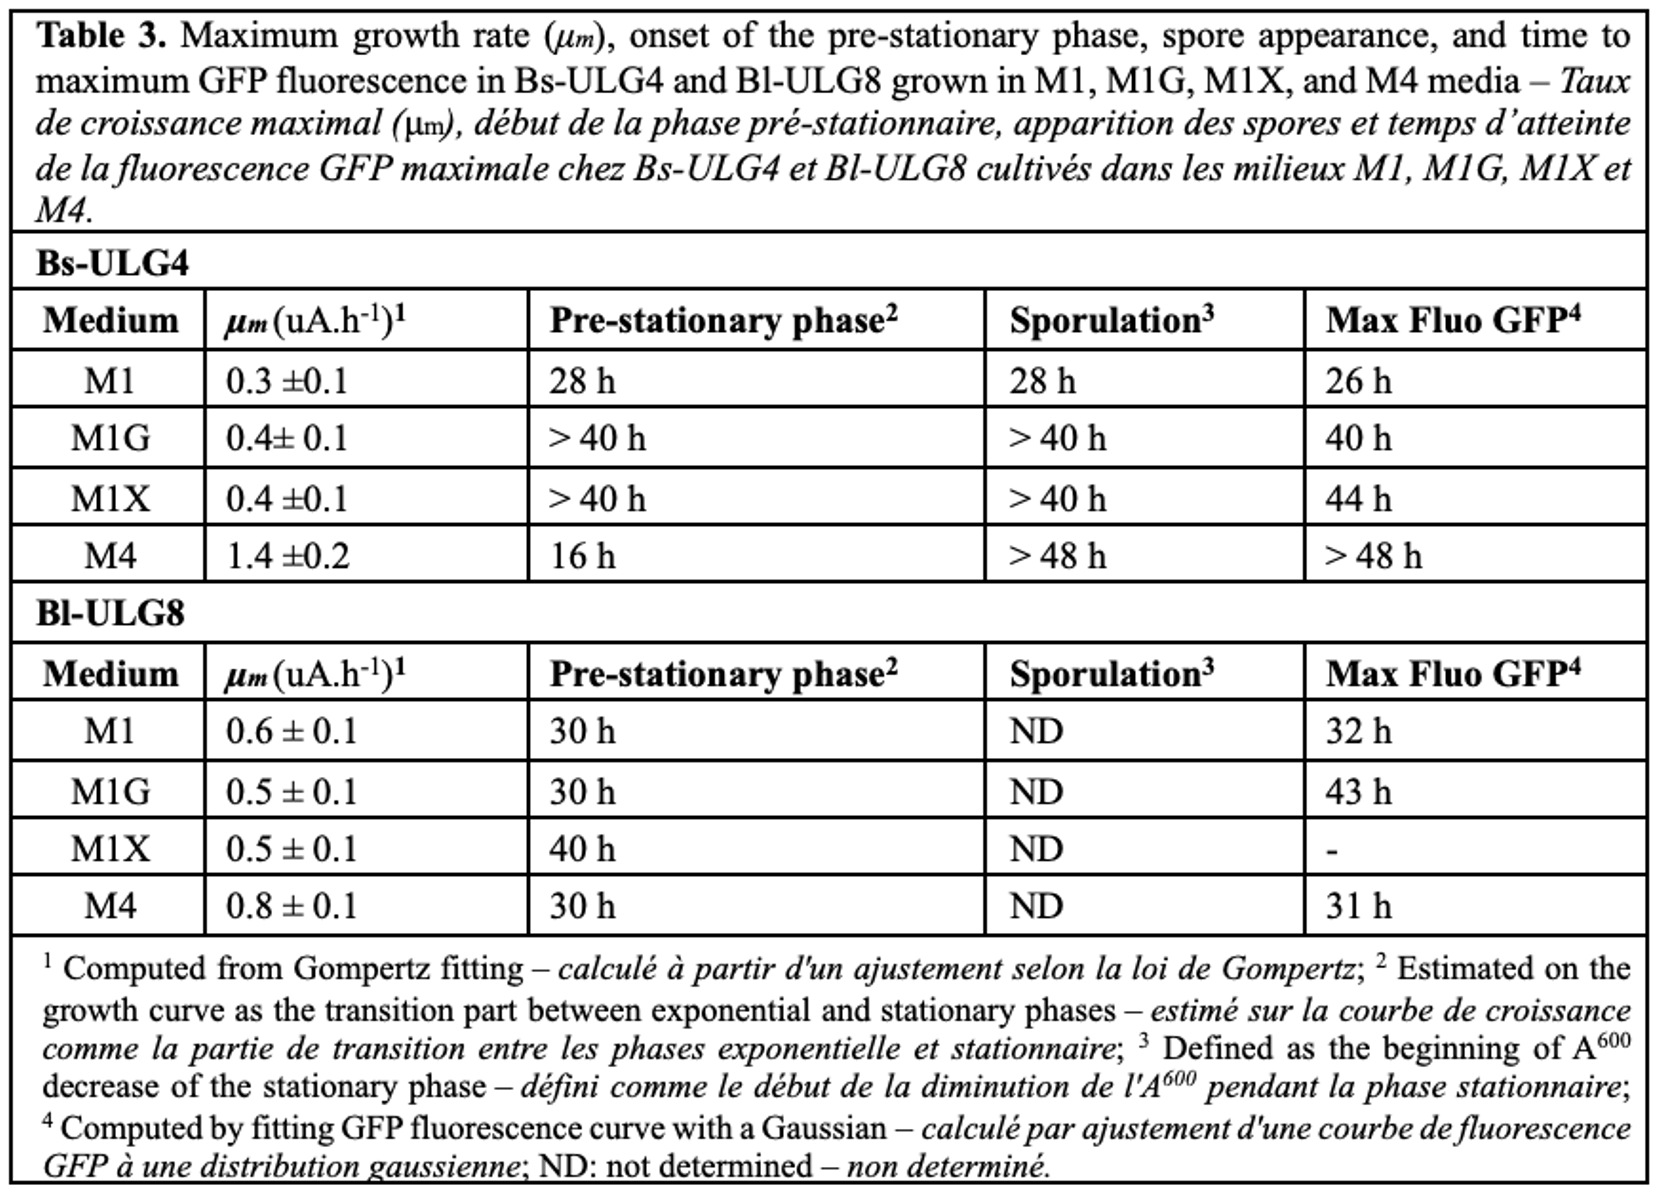
26Figure 3 shows the growth curves of the Bs-ULG4 and Bl-ULG8 strains in M1 culture medium, with or without the addition of glucose (0.5%, M1G) or xylose (0.5%, M1X), and in M4 industrial medium. The evolution of GFP fluorescence during cell growth was also measured over time for both strains. For the Bs-ULG4 strain grown in M1 medium, the transition phase between the exponential and stationary phases (pre-stationary phase) occurs between 24 and 28 h of culture, followed by a decrease in the culture's turbidity as measured by A600 (Figure 3A). This decrease in cell density in B. subtilis is generally associated with spore formation in the culture medium. In the presence of glucose or xylose in the M1 medium, cell density increases, and the pre-stationary phase occurs between 36 and 40 h, followed by a drop in cell density. The growth of Bs-ULG4 in the M4 medium is faster than in the other three tested media, with the stationary phase reached after 16 h and maintained until 48 h without a decrease in cell density, indicating that sporulation did not occur. The fitting of these four growth curves, excluding the decay phases, to the modified Gompertz equation (Zwietering et al., 1990) is good (r² ≥ 0.98), and the maximum specific growth rates (µm) were computed and are listed in table 3. As expected, the highest µm was obtained for M4 medium (µm = 1.4 ± 0.2 A600·h-1) and the lowest for M1 medium (µm = 0.3 ± 0.1 A600·h-1).
27The measurement of GFP fluorescence during culture (total fluorescence) highlights the appearance of a peak in GFP production in M1, M1G, and M1X media but not in M4 (Figure 3A). In M1 medium, maximum fluorescence is obtained after 28 h of culture. In M1G and M1X media, maximum fluorescence is shifted to 40 and 44 h, respectively. In M4 medium, low fluorescence is measured after 40 h. The evolution of GFP fluorescence divided by A600 over time, which can be interpreted as mean fluorescence per cell, is also shown in figure 3A and confirms the results obtained for total fluorescence (Table 3).
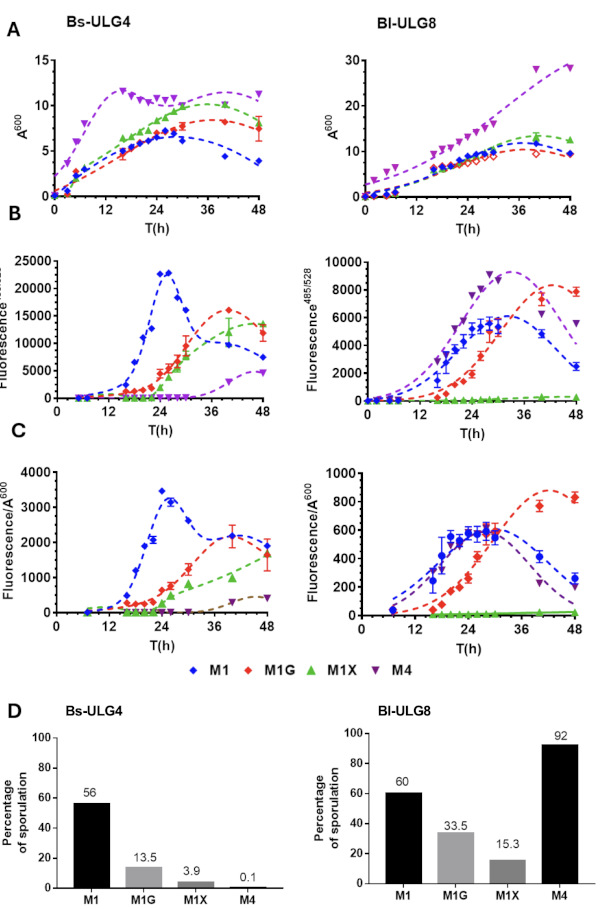
Figure 3. GFP fluorescence expression of Bs-ULG4 and Bl-ULG8 during growth in M1, M1G, M1X, and M4 media – Expression de la fluorescence GFP chez Bs-ULG4 et Bl-ULG8 au cours de leur croissance dans les milieux M1, M1G, M1X et M4.
For each strain and medium condition, the following parameters are shown from top to bottom: bacterial growth (A), measured by culture turbidity at A600; total GFP fluorescence (B, Fluo); and mean GFP fluorescence per cell (C, Fluo/A600). D shows sporulation yields. GFP fluorescence data were fitted using a Gaussian equation. Data represent mean values ± standard deviations from three independent biological replicates. Additional details are provided in the text and Materials and methods section – Pour chaque souche et chaque condition de milieu, les paramètres suivants sont présentés de haut en bas : la croissance bactérienne (A), mesurée par la turbidité de la culture à A600 ; la fluorescence GFP totale (B, Fluo) ; et la fluorescence GFP moyenne par cellule (C, Fluo/A600). D présente les rendements de sporulation. Les données de fluorescence GFP ont été ajustées à l'aide d'une équation gaussienne. Les données représentent les valeurs moyennes ± les écarts-types issus de trois réplicats biologiques indépendants. Des détails supplémentaires sont fournis dans le texte et dans la section Matériel et méthodes.
28Sporulation yields for Bs-ULG4 after 4 h of culture were determined under four culture conditions and were consistent with GFP fluorescence profiles. In the M1 medium, Bs-ULG4 reached a sporulation rate of 56%, whereas sporulation rate in M1G and M1X media were only 13.5% and 3.9%, respectively, in agreement with the delayed onset of sporulation under these conditions (Figure 3-C). In contrast, only 0.1% of viable cells formed spores in the M4 medium after 48 h, confirming that Bs-ULG4 sporulation was indeed inhibited in this medium.
29The growth curves of Bl-ULG8 in the four culture media studied are shown in Figure 3B. As observed for Bs-ULG4, the M4 medium supported both the highest cell density and the highest maximum specific growth rate (µm = 0.8 ± 0.1 A600·h-1). In comparison, µmax values in M1, M1G, and M1X ranged from 0.4 to 0.5 A600·h-1. After 48 h of cultivation, cultures grown in M1, M1G and M1X exhibited a slight decrease in cell density; however, this decrease was less pronounced than that observed for Bs-ULG4. No reduction in cell density was detected in the M4 medium, mirroring the behaviour of Bs-ULG4 (Figure 3A-B).
30Total GFP fluorescence monitored throughout cultivation revealed distinct fluorescence maxima after 32, 43, and 31 h for the M1, M1G, and M4 media, respectively. Unexpectedly, cultures grown in M1X displayed only a marginal increase in fluorescence over the 48 h cultivation period.
31Normalization of GFP fluorescence to cell density (Fluo/A600) does not alter the above analysis. However, the fluorescence profiles obtained in M1 and M4 are now very similar for Bs-ULG8. As observed for Bs-ULG4, the peak of mean fluorescence per cell was shifted to later time points in the M1G medium. Monitoring glucose concentration throughout cultivation further supported the relationship between glucose depletion and the initiation of sporulation, as evidenced by the increase in GFP fluorescence (Figure 4). After 48 h of cultivation, the highest sporulation efficiency was observed in the M4 medium for Bs-ULG8, where 92% of the bacterial population had sporulated. In comparison, sporulation efficiency reached 60% for the M1 and 33.5% for M1G, consistent with the delayed sporulation observed in the presence of glucose.
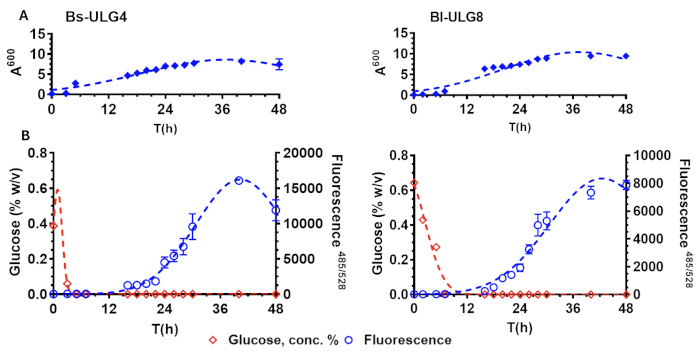
Figure 4. Monitoring of bacterial growth, glucose consumption, and GFP-mut3 fluorescence during cultivation of Bs-ULG4 and Bl-ULG8 in M1G medium – Suivi de la croissance bactérienne, de la consommation de glucose et de la fluorescence GFP-mut3 au cours de la croissance de Bs-ULG4 et Bl-ULG8 dans le milieu M1G.
Growth was assessed by measuring culture turbidity at 600 nm (A600, A). Glucose concentration was determined throughout the culture, and fluorescence was recorded as bulk GFP-mut3 signal (B). Data represent mean values ± standard deviation from three independent biological replicates – La croissance a été évaluée en mesurant la turbidité de la culture à 600 nm (A600, A). La concentration en glucose a été déterminée tout au long de la culture et la fluorescence a été enregistrée sous forme de signal global de la GFP-mut3 (B). Les données correspondent aux valeurs moyennes ± l'écart-type issues de trois réplicats biologiques indépendants.
3.3. Sporulation dynamics analyzed by flow cytometry
32Flow cytometry was used to analyze single-cell fluorescence during the growth of Bl-ULG8 in M1 medium. The raw fluorescence distributions were deconvoluted into distinct subpopulations corresponding to different physiological states, allowing a quantitative assessment of the progression of sporulation over time. The fluorescence per cell was then correlated with the total culture fluorescence measured by plate reader (Figure 5).
33At the start of the culture, a single fluorescence peak at 528 nm, corresponding to the intrinsic fluorescence of the bacteria or light scattering, is observed. This indicates a homogeneous population with no detectable gfp-mut3 expression.
34After 16 h of culture, 37% of the bacterial population exhibits fluorescence higher than the intrinsic level, indicating the emergence of a heterogeneous population in which a fraction of the cells has initiated sporulation while the rest remains in the vegetative state.
35The maximum fluorescence per cell is observed after 24 h of culture, revealing two main fluorescence peaks: one corresponding to cells producing GFP-mut3 at high levels and another with fluorescence lower than the intrinsic level. The exact nature of this second peak is unknown but may correspond to lysed cells during sporulation. If so, this would suggest that most cells have initiated sporulation at this stage. This observation is consistent with the peak of total fluorescence observed after 32 h of culture (Figures 3 and 5).
36The appearance of spores in the culture medium is evidenced by the emergence of a new peak with fluorescence corresponding to the intrinsic fluorescence observed for bacteria at t = 0 h. After 48 h of culture, flow cytometry analysis reveals that 68% of the population is in the form of spores, a value very close to the 60% obtained by spore counting (Figure 3C).
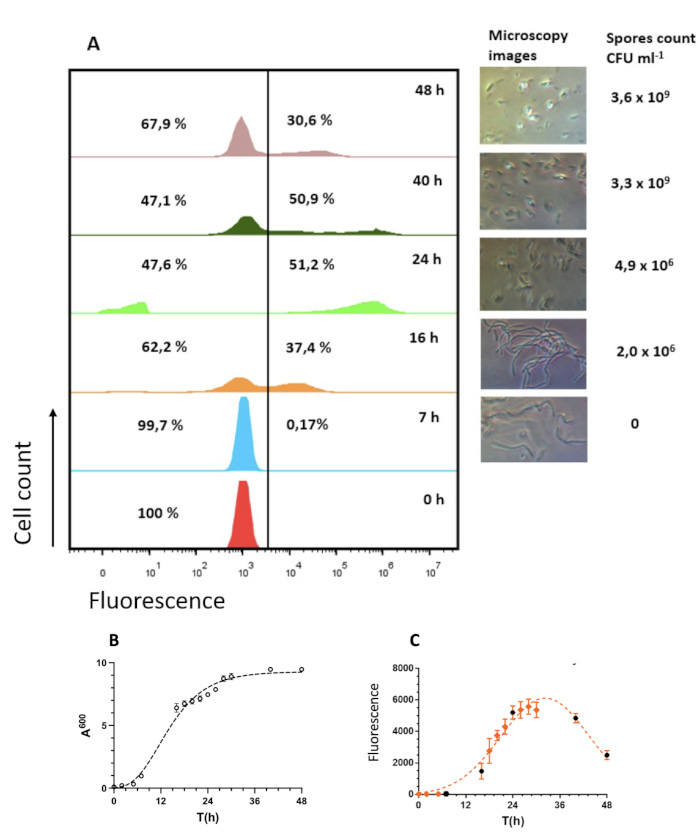
Figure 5. Flow cytometry analysis of GFP-producing Bl-ULG8 cells during growth in M1G medium – Analyse par cytométrie en flux des cellules de Bl-ULG8 produisant la GFP au cours de la croissance dans le milieu M1G.
A. Single-cell fluorescence distributions at different time points (0, 7, 16, 24, 40, and 48 h) and phase-contrast microscopy images of the culture at representative time points. These observations are consistent with the fluorescence subpopulations detected by flow cytometry. Raw fluorescence profiles were deconvoluted into subpopulations corresponding to different physiological states during sporulation. Sampling times are indicated in the upper left corner of each panel. At 0 and 7 h, a single peak corresponding to the intrinsic fluorescence of vegetative cells is observed. The vertical line separates non-sporulating cells (left) from sporulating cells (right). The percentages of each subpopulation were calculated by integrating the areas under the corresponding peaks using the formula: % sporulating cells = (area of sporulating peaks / total peak area) × 100. Spore counts determined by plating are shown on the right of each panel – Répartitions de la fluorescence au niveau de chaque cellule à différents moments (0, 7, 16, 24, 40 et 48 h) et images de la culture en microscopie à contraste de phase à des moments représentatifs. Ces observations concordent avec les sous-populations de fluorescence détectées par cytométrie en flux. Les profils de fluorescence bruts ont été déconvolués en sous-populations correspondant à différents états physiologiques au cours de la sporulation. Les moments d'échantillonnage sont indiqués dans le coin supérieur gauche de chaque panneau. À 0 et 7 h, on observe un pic unique correspondant à la fluorescence intrinsèque des cellules végétatives. La ligne verticale sépare les cellules non sporulantes (à gauche) des cellules sporulantes (à droite). Les pourcentages de chaque sous-population ont été calculés en intégrant les aires sous les pics correspondants à l’aide de la formule suivante : % de cellules sporulantes = (aire des pics de sporulation / aire totale des pics) × 100. Les comptages de spores déterminés par ensemencement sont indiqués à droite de chaque panneau; B. Growth curve of Bl-ULG8 in M1G medium – Courbe de croissance de Bl-ULG8 dans un milieu M1G; C. Bulk GFP-mut3 fluorescence measured in the same cultures. Black dots indicate the sampling times used for single-cell flow cytometry analysis – Fluorescence globale de GFP-mut3 mesurée dans les mêmes cultures. Les points noirs indiquent les moments d’échantillonnage utilisés pour l’analyse par cytométrie en flux unicellulaire.
3.4. Sporulation dynamics at pilot scale
37To better characterize sporulation dynamics under conditions representative of an industrial process, Bs-ULG4 and Bl-ULG8 were cultivated in 20 L fermenters using M1 and M4 media. This scale-up was intended to validate the reproducibility of the kinetics observed at laboratory scale while enabling more precise monitoring of cell physiology and sporulation yield under controlled conditions.
38Cultures were carried out in two independent fermenters for 48 h at 37 °C, with pH maintained at 7 and dissolved oxygen controlled (for further details, see Materials and methods). Samples were collected throughout the cultivation to measure A600, GFP-mut3 fluorescence, total viable counts, and spore counts. Figure 6 presents the results obtained for a Bs-ULG4 culture as an example, and Table 4 compares the sporulation yields obtained in shake-flask culture and in the two fermenters. Similar results were obtained for Bl-ULG8 (data not shown).
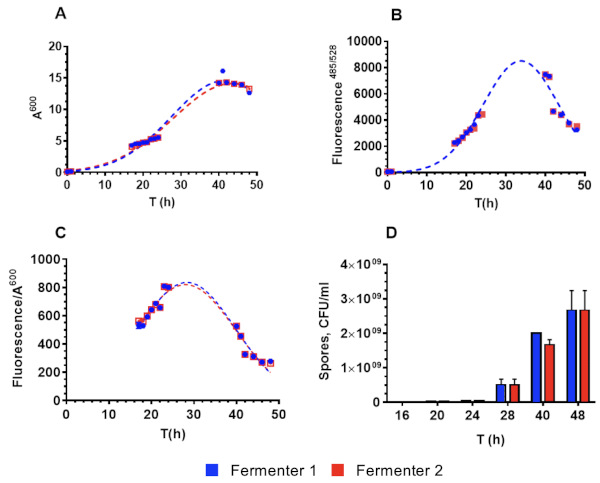
Figure 6. Growth dynamics of Bs-ULG4 in M1 medium (A), expression of PspoIIE-gfp-mut3 (B), fluorescence per cell (C), and spore counts (D) in the two fermenters. Further details are provided in the text and Materials and methods sections – Dynamique de croissance de Bs-ULG4 dans le milieu M1 (A), expression du rapporteur PspoIIE-gfp-mut3 (B), fluorescence moyenne par cellule (C) et dénombrement des spores (D) dans deux fermenteurs. Plus de détails sont fournis dans le texte et dans la partie Matériels et méthode.
4. DISCUSSION
39In industrial processes involving spore-forming Bacillus species, efficient large-scale production requires culture conditions that ensure high cell density, short process times, and high sporulation yields. The selection of optimal media and process parameters therefore relies on accurate and timely quantification of endospores (Biermann & Beutel, 2023; Biermann et al., 2023).
40The standard method for monitoring sporulation is based on CFU counts after heat treatment to eliminate vegetative cells. Although reliable, this approach is time-consuming due to sample preparation and incubation steps (Biermann et al., 2022). Alternative methods include the quantification of dipicolinic acid (DPA), a specific spore biomarker, which can be measured by colorimetric assays or by fluorescence-based methods after complexation with lanthanides (Rotman & Fields, 1968; Hindle and Hall, 1999; Bi et al., 2023). While these approaches can provide accurate measurements, they often require dedicated equipment, additional sample preparation, or skilled personnel. Microscopy-based methods, such as phase-contrast observation or Schaeffer–Fulton staining (Hamouda et al., 2002), are simpler but remain labour-intensive and are not well-suited for real-time monitoring or high-throughput screening.
41Consequently, most conventional methods for spore detection are not compatible with rapid or in-process monitoring of sporulation dynamics. To overcome these limitations, reporter systems based on reporter enzymes (e.g., firefly luciferase) or fluorescent proteins have been proposed, allowing the detection of specific physiological states at the single-cell level (Maamar & Dubnau, 2005; Mirouze et al., 2011). In the present study, we developed a Bacillus reporter strain in which GFP-mut3 expression is controlled by a sporulation-specific promoter, enabling real-time monitoring of sporulation initiation under both laboratory and pilot-scale conditions.
42To identify a suitable reporter for sporulation monitoring, three promoters associated with different stages of the process were initially selected. The spo0A, spoIIE, and spoIIIAA promoters were chosen to represent early, intermediate, and later stages of sporulation, respectively, based on previous studies. This comparative approach was designed to identify a promoter providing a clear and temporally relevant signal during the transition from vegetative growth to spore formation. Among the three promoters from Bacillus subtilis 168, selected upstream of the spo0A, spoIIE, and spoIIIAA genes and fused to gfp-mut3, only the spoIIE promoter effectively monitored the initiation of sporulation and the transient expression of spoIIE in B. subtilis 168. The same construct applied to B. licheniformis MW3 produced similar results.
43A possible explanation for the absence of detectable GFP-mut3 signal with the spo0A and spoIIIAA promoter fusions is that the cloned upstream regions did not contain the actual promoter elements. The promoter fragments were initially selected based on gene annotations from GenBank (B. subtilis 168: Genbank id: AL00916). However, a detailed inspection of the corresponding loci using the SubtiWiki database (Elfmann et al., 2025), which includes transcriptomic data (Nicolas et al., 2012), indicates a more complex transcriptional organization.
44For spo0A, transcriptomic data reveal the presence of a long 5′ untranslated region (5′ UTR, S914, 153 bp) upstream of the spo0A coding sequence, with the transcription start site located further upstream than the region amplified in this study. The approximately 200 bp fragment cloned upstream of gfp-mut3 therefore likely covered the 5′ UTR and the intergenic region between S914 and spo0A, but not the native promoter region, which would explain the lack of detectable expression. This interpretation is consistent with previous studies. For example, in the work of Mirouze et al. (2011), the authors identified promoter activity in the region upstream of spo0A, but the fragment used for the luciferase reporter construction was approximately 1,000 bp in length. This fragment included part of the upstream spoIVB gene as well as the intergenic region between spoIVB and spo0A. Under these conditions, a clear luciferase signal was detected. This observation supports the hypothesis that the functional promoter region controlling spo0A expression is located further upstream than the 200 bp fragment used in the present study.
45A similar situation appears to occur for the spoIIIAA locus. SubtiWiki annotations indicate the presence of an upstream small gene (yqhV, 282 bp) and a short RNA feature (S919, 75 bp). Transcriptomic profiles suggest that yqhV, S919, and spoIIIAA are transcribed as a single transcriptional unit. Under this organization, the actual promoter is expected to be located upstream of yqhV. Consequently, the 200 bp fragment amplified immediately upstream of spoIIIAA would not include the functional promoter, resulting in the absence of GFP-mut3 expression.
46In contrast, the fragment cloned upstream of spoIIE appears to contain the native promoter region, as evidenced by the clear and transient GFP expression observed during the early stages of sporulation. This supports the functionality of the reporter system and suggests that the lack of signal from the spo0A and spoIIIAA constructs is most likely due to incomplete promoter regions rather than an intrinsic limitation of the GFP-based approach.
47Monitoring of the fluorescent signal over time, using both fluorimetry and flow cytometry, revealed an increase in fluorescence intensity during the exponential growth phase, followed by a gradual decrease upon entry into the stationary phase. This dynamic correlated with the increase in spore counts observed during cultivation and can be explained by the progressive sequestration of the SpoIIE protein into the forespore compartment, as described in the literature.
48In addition, flow cytometry analyses made it possible to characterize the heterogeneity of the cellular populations and to identify the subpopulations expressing PspoIIE-gfpmut3, corresponding to cells effectively engaged in the sporulation process. These results confirm the interest of GFP-mut3 as a reporter protein for monitoring PspoIIE expression and, consequently, the onset of sporulation in both B. subtilis 168 and B. licheniformis MW3.
49The shift of PspoIIE-gfp-mut3 expression toward later cultivation times in the presence of sugar is consistent with the regulation of the spoIIE gene, whose expression depends on both the sigma factor σF (forespore-specific) and Spo0A (Elfmann et al., 2025). The latter is a key transcription factor acting as a central regulator in the decision to initiate sporulation in response to nutrient limitation. Activation of Spo0A occurs through phosphorylation (Spo0A~P) via a phosphorelay system. The presence of sugars such as glucose in the medium delays sporulation by repressing the phosphorylation cascade responsible for Spo0A activation. This maintains low levels of Spo0A~P, resulting in a global delay of the sporulation process and, consequently, a shift in spoIIE expression (Errington, 2003).
50Importantly, the reporter system proved to be directly transferable to pilot-scale conditions. Similar fluorescence dynamics and sporulation profiles were observed in 20 L fermenter cultures, demonstrating that the PspoIIE-gfpmut3 construct remains functional and informative under controlled bioprocess conditions. This scalability highlights the potential of the system as a practical tool for monitoring and optimizing sporulation in industrial settings.
51From a broader perspective, the choice of the spoIIE promoter as a reporter element is likely to be applicable to a wide range of endospore-forming members of the Bacillota, as spoIIE is a highly conserved gene involved in the early stages of sporulation. This suggests that the general strategy described here could be transferred to other industrially relevant Bacillus species and related spore-forming bacteria.
52The main practical limitation of this approach lies in the genetic modification step required to introduce the reporter plasmid into the strain of interest. Depending on the species or industrial isolate, transformation efficiency can vary considerably and may represent a technical bottleneck. In some cases, the development of suitable transformation protocols or the use of alternative integration strategies may be necessary.
53Despite this limitation, the reporter system presented here is well suited for high-throughput screening applications. Because fluorescence can be monitored rapidly and non-destructively, either in microplate readers or by flow cytometry, this approach enables the simultaneous evaluation of multiple culture conditions, media compositions, or strain variants. Such capability is particularly valuable for the rapid optimization of sporulation processes and for the selection of improved industrial strains.
5. CONCLUSIONS
54This study demonstrates that the PspoIIE–gfp reporter system provides a simple and effective tool for monitoring the initiation and dynamics of sporulation in Bacillus species under both laboratory and pilot-scale conditions. The approach enables real-time, non-destructive analysis of sporulation and is compatible with high-throughput screening strategies.
55The results also open the way to new experimental approaches aimed at better understanding the metabolic regulation of sporulation in response to different nutrient conditions. Future work should examine the combined effects of multiple carbon sources and varying nitrogen sources on growth and sporulation, using both wild-type and mutant strains of B. subtilis and B. licheniformis.
56Such studies would help identify optimal conditions for efficient spore production and provide deeper insight into the integration of metabolic signals into the genetic regulation of sporulation, with direct implications for industrial applications. Because spoIIE is highly conserved among endospore-forming members of the Bacillota, the strategy described here could be extended to other industrially relevant Bacillus species and related spore-forming bacteria. Such reporter strains could facilitate rapid screening of culture media, process parameters, or genetic variants in high-throughput formats.
57Acknowledgements
58The authors gratefully acknowledge the members of Bacterial Physiology and Genetics Lab for their assistance, as well as ARTECHNO and THT members for their valuable discussions and support.
Bibliographie
Bi N. et al., 2023. Highly selective and multicolor ultrasensitive assay of dipicolinic acid: The integration of terbium(III) and gold nanocluster. Spectrochim. Acta, Part A., 284, 121777, doi.org/10.1016/j.saa.2022.121777
Biermann R. et al., 2022. Facilitated endospore detection for Bacillus spp. through automated algorithm-based image processing. Eng. Life Sci., 22, 299-307, doi.org/10.1002/elsc.202100137
Biermann R. & Beutel S., 2023. Endospore production of Bacillus spp. for industrial use. Eng. Life Sci., 23, e2300013, doi.org/10.1002/elsc.202300013
Biermann R. et al., 2023. Bioprocess development for endospore production by Bacillus coagulans using an optimized chemically defined medium. Eng. Life Sci., 23, e2300210, doi.org/10.1002/elsc.202300210
Bipp H.P., Fisher K., Bieniek D. & Kettrup A., 1997. Application of ion exclusion chromatography (IEC) for the determination of sugar and carboxylic acids in hydrolysates from carbohydrate containing residues. Fresenius J. Anal. Chem., 357, 321-325, doi.org/10.1007/s002160050161
Biswas S., Kim M.H., Baek D.H. & Kim I.H., 2023. Probiotic mixture (Bacillus subtilis and Bacillus licheniformis) a potential in-feed additive to improve broiler production efficiency, nutrient digestibility, caecal microflora, meat quality and to diminish hazardous odour emission. J. Anim. Physiol. Anim. Nutr. (Berl), 107, 1065-1072, doi.org/10.1111/jpn.13784
Carniol K., Ben-Yehuda S., King N. & Losick R., 2005. Genetic dissection of the sporulation protein SpoIIE and its role in asymmetric division in Bacillus subtilis. J. Bacteriol., 187, 3511-3520, doi.org/10.1128/JB.187.10.3511-3520.2005
Chau K.M. et al., 2021. Molecular identification and characterization of probiotic Bacillus species with the ability to control Vibrio spp. in wild fish intestines and sponges from the Vietnam sea. Microorganisms, 9(9), 1927, doi.org/10.3390/microorganisms9091927
Cormack B.P., Valdivia R.H. & Falkow S., 1996. FACS-optimized mutants of the green fluorescent protein (GFP). Gene, 173, 33-38, doi.org/10.1016/0378-1119(95)00685-0
Cutting S.M., 2011. Bacillus probiotics. Food Microbiol., 28, 214-220, doi.org/10.1016/j.fm.2010.03.007
Dauvin M., 2020. Voie de signalisation menant à l’expression de la ß-lactamase BlaP de Bacillus licheniformis. Thèse de doctorat : Université de Liège (Belgique).
Dubnau D. & Losick R., 2006. Bistability in bacteria. Mol. Microbiol., 61, 564-572, doi.org/10.1111/j.1365-2958.2006.05249.x
Elfmann C., Dumann V., Van den Berg T. & Stülke J., 2025. A new framework for SubtiWiki, the database for the model organism Bacillus subtilis. Nucleic Acids Res., 53, D1, D864-D870, doi.org/10.1093/nar/gkae957
Elshaghabee F.M.F. et al., 2017. Bacillus as potential probiotics: status, concerns, and future perspectives. Front. Microbiol., 8, 1490, doi.org/10.3389/fmicb.2017.01490
Errington J., 2003. Regulation of endospore formation in Bacillus subtilis. Nat. Rev. Microbiol., 1, 117-126, doi.org/10.1038/nrmicro750
Etesami H., Jeong B.R. & Glick B.R., 2023. Potential use of Bacillus spp. as an effective biostimulant against abiotic stresses in crops—A review. Curr. Res. Biotechnol., 5, 100128, doi.org/10.1016/j.crbiot.2023.100128
Guillot C. & Moran C.P. Jr., 2007. Essential internal promoter in the spoIIIA locus of Bacillus subtilis. J. Bacteriol., 189, 7181-7189, doi.org/10.1128/JB.00915-07
Hamouda T., Shi A.Y. & Baker J.R., 2002. A rapid staining technique for the detection of initiation of germination of bacterial spores. Appl. Microbiol., 34, 86-90, doi.org/10.1046/j.1472-765x.2002.01047.x
He Y. et al., 2025. A novel regulation on the developmental checkpoint protein Sda that controls sporulation and biofilm formation in Bacillus subtilis. J .Bacteriol., 207, e00210-24, doi.org/10.1128/jb.00210-24
Hindle A.A. & Hall E.A., 1999. Dipicolinic acid (DPA) assay revisited and appraised for spore detection. Analyst, 124, 1599-1604, doi.org/10.1039/a906846e
Hoffmann K. et al., 2010. Facilitation of direct conditional knockout of essential genes in Bacillus licheniformis DSM13 by comparative genetic analysis and manipulation of genetic competence. Appl. Environ. Microbiol., 76, 5046-5057, doi.org/10.1128/AEM.00660-10
Kan L. et al., 2021. Probiotics Bacillus licheniformis improves intestinal health of subclinical necrotic enteritis-challenged broilers. Front. Microbiol., 12, 623739, doi.org/10.3389/fmicb.2021.623739
Kunst F. et al., 1997. The complete genome sequence of the gram-positive bacterium Bacillus subtilis. Nature, 390, 249-256, doi.org/10.1038/36786
Maamar H. & Dubnau D., 2005. Bistability in the Bacillus subtilis K-state (competence) system requires a positive feedback loop. Mol. Microbiol., 56, 615-624, doi.org/10.1111/j.1365-2958.2005.04592.x
Mckenney P.T., Driks A. & Eichenberger P., 2013. The Bacillus subtilis endospore: assembly and functions of the multilayered coat. Nat. Rev. Microbiol., 11, 33-44, doi.org/10.1038/nrmicro2921
Mirouze N., Prepiak P. & Dubnau D., 2011. Fluctuations in spo0A transcription control rare developmental transitions in Bacillus subtilis. PLoS Genet., 7, e1002048, doi.org/10.1371/journal.pgen.1002048
Msadek T. et al., 1998. ClpP of Bacillus subtilis is required for competence development, motility, degradative enzyme synthesis, growth at high temperature and sporulation. Mol. Microbiol., 27, 899-914, doi.org/10.1046/j.1365-2958.1998.00735.x
Muras A., Romero M., Mayer C. & Otero A., 2021. Biotechnological applications of Bacillus licheniformis. Crit. Rev. Biotechnol., 41, 609-627, doi.org/10.1080/07388551.2021.1873239
Nicolas P.P. et al., 2012. Condition-dependent transcriptome reveals high-level regulatory architecture in Bacillus subtilis. Science, 335(6072), 1103-1106, doi.org/10.1126/science.1206848
Riley E.P., Schwarz C., Derman A.I. & Lopez-Garrido J., 2020. Milestones in Bacillus subtilis sporulation research. Microb. Cell, 8, 1-16, doi.org/10.15698/mic2021.01.739
Rotman Y. & Fields M.L., 1968. A modified reagent for dipicolinic acid analysis. Anal. Biochem., 22, 168, doi.org/10.1016/0003-2697(68)90272-8
Sarita B., Samadhan D., Hassan M.Z. & Kovaleva E.G., 2025. A comprehensive review of probiotics and human health-current prospective and applications. Front. Microbiol., 15, 1487641, doi.org/10.3389/fmicb.2024.1487641
Shahzad M. et al., 2025. Biofertilizers in sustainable agriculture: mechanisms, applications and future prospects. Discover Agric., 3, 224, doi.org/10.1007/s44279-025-00318-0
Stanton C. et al., 2001. Market potential for probiotics. Am. J. Clin. Nutr., 73, 476S-483S, doi.org/10.1093/ajcn/73.2.476s
Stulke J., Gruppen A., Bramkamp M. & Pelzer S., 2023. Bacillus subtilis, a Swiss army knife in science and biotechnology. J. Bacteriol., 205, e0010223, doi.org/10.1128/jb.00102-23
Todorov S.D. et al., 2022. Bacillus spore-forming probiotics: benefits with concerns? Crit. Rev. Microbiol., 48, 513-530, doi.org/10.1080/1040841X.2021.1983517
Veith B. et al., 2004. The complete genome sequence of Bacillus licheniformis DSM13, an organism with great industrial potential. J. Mol. Microbiol. Biotechnol., 7, 204-211, doi.org/10.1159/000079829
Xiao Y. H. et al., 2007. Asymmetric overlap extension PCR method bypassing intermediate purification and the amplification of wild-type template in site-directed mutagenesis. Biotechnol. Lett., 29, 925-930, doi.org/10.1007/s10529-007-9327-4
Zwietering M.H., Jongenburger I., Rombouts F.M. & Van 'T Riet K., 1990. Modeling of the bacterial growth curve. Appl. Environ. Microbiol., 56, 1875-1881, doi.org/10.1128/aem.56.6.1875-1881.1990
